|
Download Data (XLS File) |
|
|||||
|
|||||
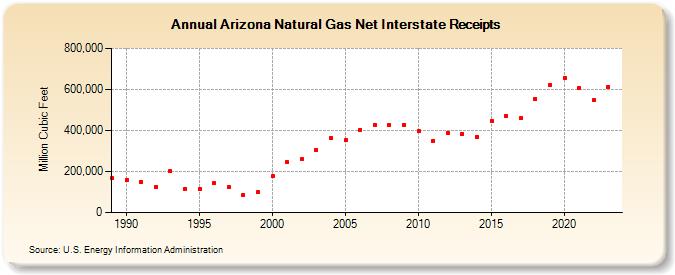
| Arizona Natural Gas Net Interstate Receipts (Million Cubic Feet) | |||||
| Decade | Year-0 | Year-1 | Year-2 | Year-3 | Year-4 | Year-5 | Year-6 | Year-7 | Year-8 | Year-9 |
|---|---|---|---|---|---|---|---|---|---|---|
| 1980's | 167,384 | |||||||||
| 1990's | 157,939 | 150,756 | 126,726 | 201,356 | 115,147 | 114,944 | 143,286 | 125,217 | 86,844 | 99,504 |
| 2000's | 178,077 | 245,563 | 260,186 | 307,249 | 365,225 | 352,301 | 404,391 | 428,659 | 427,767 | 429,004 |
| 2010's | 395,316 | 348,820 | 389,036 | 384,082 | 370,465 | 446,795 | 472,293 | 459,587 | 553,681 | 622,583 |
| 2020's | 657,740 | 605,953 | 547,621 | 611,873 | 638,622 |
| - = No Data Reported; -- = Not Applicable; NA = Not Available; W = Withheld to avoid disclosure of individual company data. |
| Release Date: 6/30/2026 |
| Next Release Date: 7/31/2026 |