|
Download Data (XLS File) |
|
|||||
|
|||||
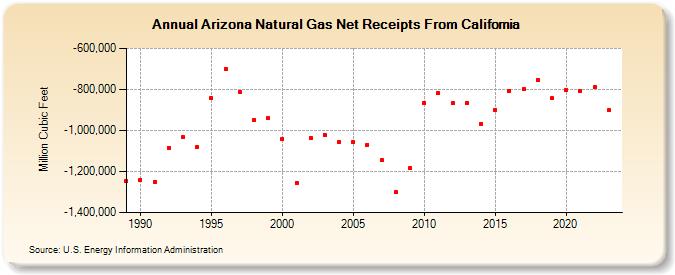
| Arizona Natural Gas Net Receipts From California (Million Cubic Feet) | |||||
| Decade | Year-0 | Year-1 | Year-2 | Year-3 | Year-4 | Year-5 | Year-6 | Year-7 | Year-8 | Year-9 |
|---|---|---|---|---|---|---|---|---|---|---|
| 1980's | -1,246,680 | |||||||||
| 1990's | -1,239,101 | -1,249,592 | -1,083,121 | -1,033,400 | -1,079,711 | -840,681 | -700,796 | -813,065 | -946,692 | -941,488 |
| 2000's | -1,040,767 | -1,255,625 | -1,035,642 | -1,020,742 | -1,058,422 | -1,055,050 | -1,068,738 | -1,144,791 | -1,301,377 | -1,182,341 |
| 2010's | -864,892 | -818,475 | -867,880 | -864,343 | -967,463 | -899,087 | -805,528 | -798,565 | -752,322 | -844,141 |
| 2020's | -802,771 | -808,562 | -790,348 | -901,736 | -816,932 |
| - = No Data Reported; -- = Not Applicable; NA = Not Available; W = Withheld to avoid disclosure of individual company data. |
| Release Date: 6/30/2026 |
| Next Release Date: 7/31/2026 |