|
Download Data (XLS File) |
|
|||||
|
|||||
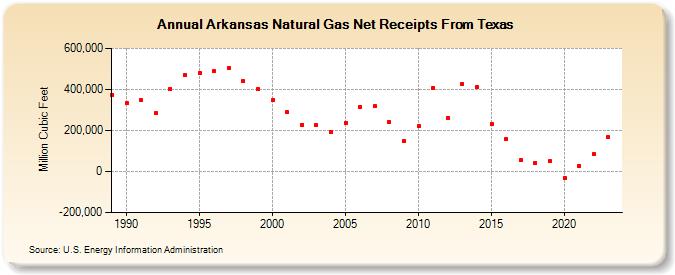
| Arkansas Natural Gas Net Receipts From Texas (Million Cubic Feet) | |||||
| Decade | Year-0 | Year-1 | Year-2 | Year-3 | Year-4 | Year-5 | Year-6 | Year-7 | Year-8 | Year-9 |
|---|---|---|---|---|---|---|---|---|---|---|
| 1980's | 374,790 | |||||||||
| 1990's | 331,866 | 346,792 | 285,327 | 402,559 | 468,038 | 479,666 | 488,073 | 503,925 | 439,744 | 400,025 |
| 2000's | 346,694 | 287,785 | 228,145 | 224,456 | 194,455 | 237,513 | 314,916 | 317,585 | 240,753 | 148,057 |
| 2010's | 220,477 | 407,665 | 262,397 | 426,976 | 409,458 | 231,017 | 157,844 | 54,920 | 43,867 | 49,166 |
| 2020's | -29,402 | 27,981 | 86,055 | 167,072 | 105,799 |
| - = No Data Reported; -- = Not Applicable; NA = Not Available; W = Withheld to avoid disclosure of individual company data. |
| Release Date: 6/30/2026 |
| Next Release Date: 7/31/2026 |