|
Download Data (XLS File) |
|
|||||
|
|||||
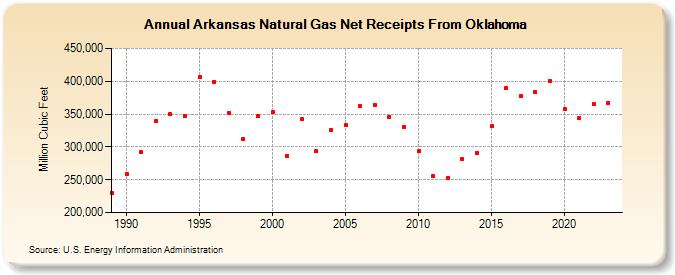
| Arkansas Natural Gas Net Receipts From Oklahoma (Million Cubic Feet) | |||||
| Decade | Year-0 | Year-1 | Year-2 | Year-3 | Year-4 | Year-5 | Year-6 | Year-7 | Year-8 | Year-9 |
|---|---|---|---|---|---|---|---|---|---|---|
| 1980's | 230,424 | |||||||||
| 1990's | 259,348 | 291,686 | 339,222 | 349,828 | 347,343 | 406,335 | 399,321 | 351,997 | 312,338 | 346,940 |
| 2000's | 353,271 | 286,393 | 342,307 | 293,696 | 325,434 | 333,223 | 362,937 | 363,256 | 346,237 | 330,149 |
| 2010's | 293,320 | 255,083 | 253,097 | 281,109 | 290,539 | 331,781 | 389,204 | 378,051 | 383,060 | 400,913 |
| 2020's | 357,071 | 344,654 | 365,935 | 367,257 | 383,356 |
| - = No Data Reported; -- = Not Applicable; NA = Not Available; W = Withheld to avoid disclosure of individual company data. |
| Release Date: 6/30/2026 |
| Next Release Date: 7/31/2026 |