|
Download Data (XLS File) |
|
|||||
|
|||||
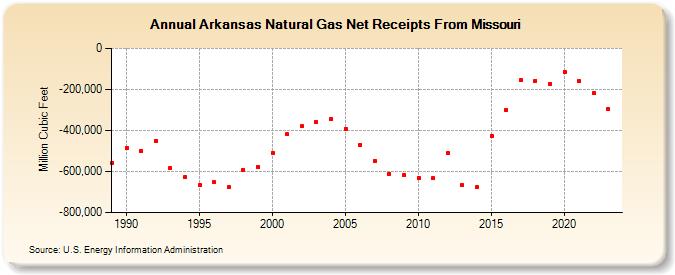
| Arkansas Natural Gas Net Receipts From Missouri (Million Cubic Feet) | |||||
| Decade | Year-0 | Year-1 | Year-2 | Year-3 | Year-4 | Year-5 | Year-6 | Year-7 | Year-8 | Year-9 |
|---|---|---|---|---|---|---|---|---|---|---|
| 1980's | -558,214 | |||||||||
| 1990's | -484,901 | -499,596 | -449,141 | -583,500 | -628,000 | -667,878 | -653,172 | -675,837 | -592,462 | -575,862 |
| 2000's | -508,796 | -418,674 | -379,630 | -357,888 | -344,515 | -390,548 | -469,057 | -547,162 | -610,499 | -617,697 |
| 2010's | -629,189 | -632,824 | -509,576 | -666,679 | -675,862 | -425,402 | -299,487 | -154,641 | -157,375 | -172,196 |
| 2020's | -114,791 | -158,631 | -216,199 | -294,737 | -175,991 |
| - = No Data Reported; -- = Not Applicable; NA = Not Available; W = Withheld to avoid disclosure of individual company data. |
| Release Date: 6/30/2026 |
| Next Release Date: 7/31/2026 |