|
Download Data (XLS File) |
|
|||||
|
|||||
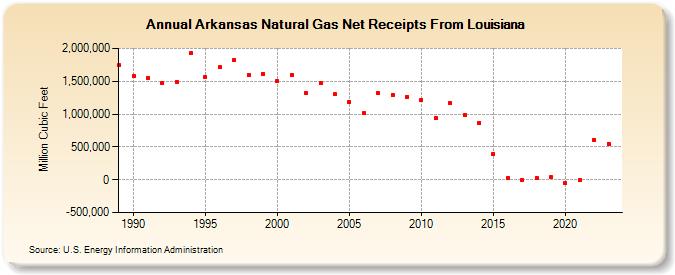
| Arkansas Natural Gas Net Receipts From Louisiana (Million Cubic Feet) | |||||
| Decade | Year-0 | Year-1 | Year-2 | Year-3 | Year-4 | Year-5 | Year-6 | Year-7 | Year-8 | Year-9 |
|---|---|---|---|---|---|---|---|---|---|---|
| 1980's | 1,743,069 | |||||||||
| 1990's | 1,587,034 | 1,547,557 | 1,468,967 | 1,490,420 | 1,929,263 | 1,560,991 | 1,712,023 | 1,821,628 | 1,596,545 | 1,616,969 |
| 2000's | 1,501,337 | 1,598,541 | 1,318,444 | 1,467,257 | 1,298,896 | 1,183,334 | 1,019,682 | 1,317,509 | 1,294,643 | 1,266,394 |
| 2010's | 1,217,773 | 933,096 | 1,166,366 | 982,475 | 869,165 | 391,939 | 21,884 | -2,809 | 29,682 | 35,782 |
| 2020's | -55,599 | -10,274 | 608,880 | 548,141 | 280,229 |
| - = No Data Reported; -- = Not Applicable; NA = Not Available; W = Withheld to avoid disclosure of individual company data. |
| Release Date: 6/30/2026 |
| Next Release Date: 7/31/2026 |