|
Download Data (XLS File) |
|
|||||
|
|||||
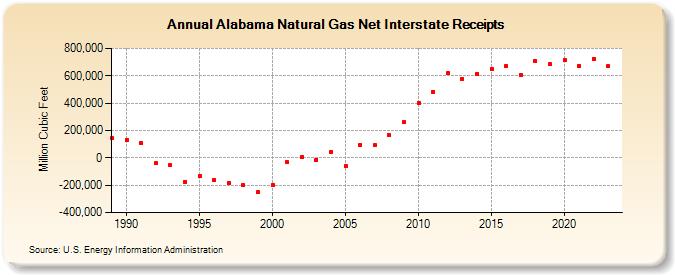
| Alabama Natural Gas Net Interstate Receipts (Million Cubic Feet) | |||||
| Decade | Year-0 | Year-1 | Year-2 | Year-3 | Year-4 | Year-5 | Year-6 | Year-7 | Year-8 | Year-9 |
|---|---|---|---|---|---|---|---|---|---|---|
| 1980's | 144,191 | |||||||||
| 1990's | 130,475 | 107,659 | -40,535 | -54,517 | -173,112 | -135,266 | -163,227 | -185,706 | -200,953 | -253,049 |
| 2000's | -197,408 | -31,303 | 4,336 | -12,963 | 43,856 | -60,547 | 97,347 | 90,558 | 166,539 | 258,787 |
| 2010's | 400,922 | 483,189 | 617,883 | 579,485 | 614,539 | 650,116 | 670,750 | 605,565 | 706,512 | 683,868 |
| 2020's | 714,866 | 673,234 | 724,998 | 670,226 | 708,410 |
| - = No Data Reported; -- = Not Applicable; NA = Not Available; W = Withheld to avoid disclosure of individual company data. |
| Release Date: 6/30/2026 |
| Next Release Date: 7/31/2026 |