|
Download Data (XLS File) |
|
|||||
|
|||||
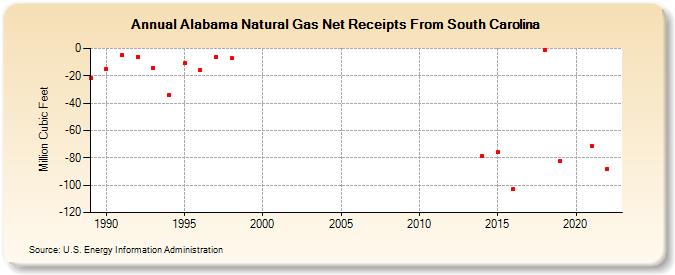
| Alabama Natural Gas Net Receipts From South Carolina (Million Cubic Feet) | |||||
| Decade | Year-0 | Year-1 | Year-2 | Year-3 | Year-4 | Year-5 | Year-6 | Year-7 | Year-8 | Year-9 |
|---|---|---|---|---|---|---|---|---|---|---|
| 1980's | -22 | |||||||||
| 1990's | -15 | -5 | -6 | -14 | -34 | -11 | -16 | -6 | -7 | |
| 2010's | -79 | -76 | -103 | -1 | -82 | |||||
| 2020's | -71 | -88 | 12 |
| - = No Data Reported; -- = Not Applicable; NA = Not Available; W = Withheld to avoid disclosure of individual company data. |
| Release Date: 6/30/2026 |
| Next Release Date: 7/31/2026 |