|
Download Data (XLS File) |
|
|||||
|
|||||
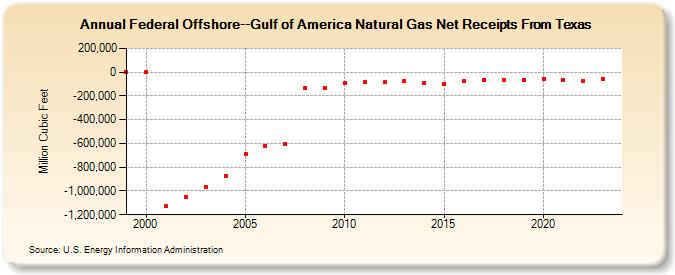
| Federal Offshore--Gulf of America Natural Gas Net Receipts From Texas (Million Cubic Feet) | |||||
| Decade | Year-0 | Year-1 | Year-2 | Year-3 | Year-4 | Year-5 | Year-6 | Year-7 | Year-8 | Year-9 |
|---|---|---|---|---|---|---|---|---|---|---|
| 1990's | 0 | |||||||||
| 2000's | 0 | -1,130,129 | -1,049,737 | -964,775 | -874,547 | -687,654 | -620,411 | -604,171 | -133,666 | -134,141 |
| 2010's | -95,499 | -84,429 | -85,479 | -70,789 | -89,968 | -100,229 | -72,058 | -63,322 | -64,771 | -65,257 |
| 2020's | -56,820 | -64,272 | -70,950 | -59,266 | -66,138 |
| - = No Data Reported; -- = Not Applicable; NA = Not Available; W = Withheld to avoid disclosure of individual company data. |
| Release Date: 6/30/2026 |
| Next Release Date: 7/31/2026 |