|
Download Data (XLS File) |
|
|||||
|
|||||
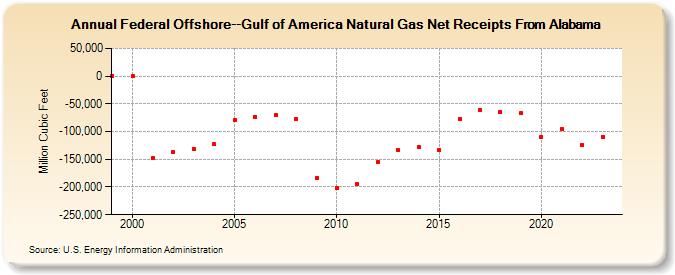
| Federal Offshore--Gulf of America Natural Gas Net Receipts From Alabama (Million Cubic Feet) | |||||
| Decade | Year-0 | Year-1 | Year-2 | Year-3 | Year-4 | Year-5 | Year-6 | Year-7 | Year-8 | Year-9 |
|---|---|---|---|---|---|---|---|---|---|---|
| 1990's | 0 | |||||||||
| 2000's | 0 | -147,408 | -136,922 | -131,698 | -123,132 | -79,598 | -72,972 | -69,934 | -78,182 | -183,546 |
| 2010's | -200,960 | -195,241 | -154,527 | -132,833 | -127,282 | -132,831 | -76,970 | -60,233 | -65,115 | -66,807 |
| 2020's | -109,417 | -95,040 | -123,511 | -109,308 | -92,189 |
| - = No Data Reported; -- = Not Applicable; NA = Not Available; W = Withheld to avoid disclosure of individual company data. |
| Release Date: 6/30/2026 |
| Next Release Date: 7/31/2026 |