|
Download Data (XLS File) |
|
|||||
|
|||||
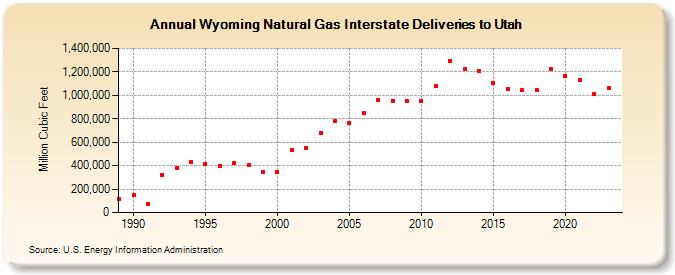
| Wyoming Natural Gas Interstate Deliveries to Utah (Million Cubic Feet) | |||||
| Decade | Year-0 | Year-1 | Year-2 | Year-3 | Year-4 | Year-5 | Year-6 | Year-7 | Year-8 | Year-9 |
|---|---|---|---|---|---|---|---|---|---|---|
| 1980's | 119,831 | |||||||||
| 1990's | 145,845 | 75,418 | 323,297 | 383,789 | 434,030 | 418,350 | 400,967 | 425,028 | 402,512 | 346,335 |
| 2000's | 345,134 | 534,891 | 554,253 | 681,632 | 781,257 | 763,403 | 846,971 | 959,955 | 954,280 | 950,647 |
| 2010's | 951,576 | 1,076,155 | 1,294,017 | 1,222,765 | 1,207,624 | 1,104,502 | 1,051,583 | 1,046,253 | 1,049,293 | 1,223,521 |
| 2020's | 1,164,300 | 1,130,724 | 1,007,148 | 1,062,809 | 930,210 |
| - = No Data Reported; -- = Not Applicable; NA = Not Available; W = Withheld to avoid disclosure of individual company data. |
| Release Date: 6/30/2026 |
| Next Release Date: 7/31/2026 |