|
Download Data (XLS File) |
|
|||||
|
|||||
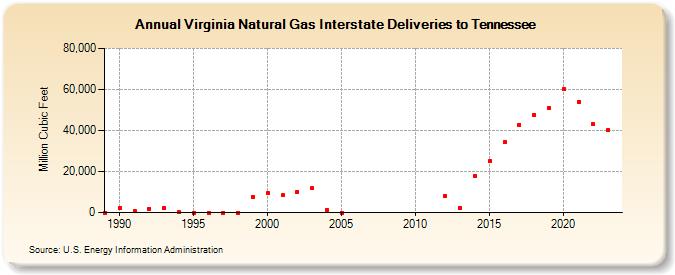
| Virginia Natural Gas Interstate Deliveries to Tennessee (Million Cubic Feet) | |||||
| Decade | Year-0 | Year-1 | Year-2 | Year-3 | Year-4 | Year-5 | Year-6 | Year-7 | Year-8 | Year-9 |
|---|---|---|---|---|---|---|---|---|---|---|
| 1980's | 0 | |||||||||
| 1990's | 2,174 | 764 | 1,896 | 2,335 | 189 | 0 | 0 | 0 | 0 | 7,769 |
| 2000's | 9,379 | 8,421 | 10,230 | 11,820 | 1,323 | 0 | ||||
| 2010's | 8,174 | 2,398 | 17,832 | 25,041 | 34,374 | 42,838 | 47,717 | 51,008 | ||
| 2020's | 60,211 | 54,039 | 42,988 | 40,022 | 52,339 |
| - = No Data Reported; -- = Not Applicable; NA = Not Available; W = Withheld to avoid disclosure of individual company data. |
| Release Date: 6/30/2026 |
| Next Release Date: 7/31/2026 |