|
Download Data (XLS File) |
|
|||||
|
|||||
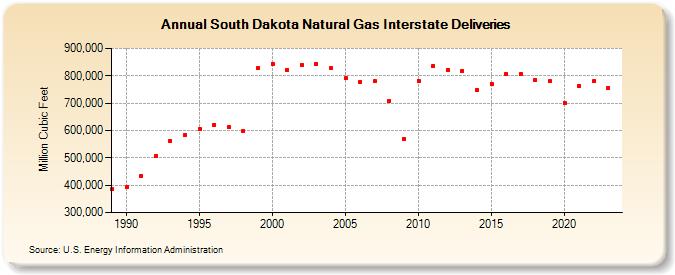
| South Dakota Natural Gas Interstate Deliveries (Million Cubic Feet) | |||||
| Decade | Year-0 | Year-1 | Year-2 | Year-3 | Year-4 | Year-5 | Year-6 | Year-7 | Year-8 | Year-9 |
|---|---|---|---|---|---|---|---|---|---|---|
| 1980's | 384,461 | |||||||||
| 1990's | 393,476 | 434,073 | 506,324 | 561,602 | 583,653 | 604,039 | 620,225 | 611,611 | 598,472 | 828,874 |
| 2000's | 844,771 | 821,521 | 840,980 | 844,233 | 826,702 | 790,124 | 778,347 | 779,639 | 708,554 | 570,439 |
| 2010's | 782,110 | 834,775 | 822,686 | 818,245 | 748,821 | 771,007 | 806,567 | 806,576 | 784,866 | 779,033 |
| 2020's | 701,011 | 762,828 | 779,550 | 755,361 | 774,811 |
| - = No Data Reported; -- = Not Applicable; NA = Not Available; W = Withheld to avoid disclosure of individual company data. |
| Release Date: 6/30/2026 |
| Next Release Date: 7/31/2026 |