|
Download Data (XLS File) |
|
|||||
|
|||||
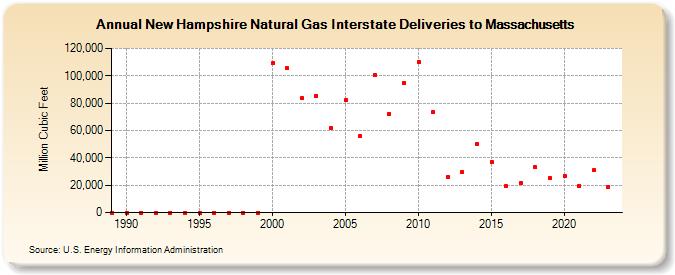
| New Hampshire Natural Gas Interstate Deliveries to Massachusetts (Million Cubic Feet) | |||||
| Decade | Year-0 | Year-1 | Year-2 | Year-3 | Year-4 | Year-5 | Year-6 | Year-7 | Year-8 | Year-9 |
|---|---|---|---|---|---|---|---|---|---|---|
| 1980's | 0 | |||||||||
| 1990's | 0 | 0 | 0 | 0 | 0 | 0 | 0 | 0 | 0 | 0 |
| 2000's | 109,100 | 105,370 | 83,419 | 85,417 | 61,560 | 82,007 | 55,953 | 100,388 | 72,391 | 94,895 |
| 2010's | 110,231 | 73,322 | 26,299 | 29,450 | 50,448 | 37,074 | 19,124 | 21,575 | 32,962 | 25,079 |
| 2020's | 26,790 | 19,457 | 30,763 | 18,912 | 28,493 |
| - = No Data Reported; -- = Not Applicable; NA = Not Available; W = Withheld to avoid disclosure of individual company data. |
| Release Date: 6/30/2026 |
| Next Release Date: 7/31/2026 |