|
Download Data (XLS File) |
|
|||||
|
|||||
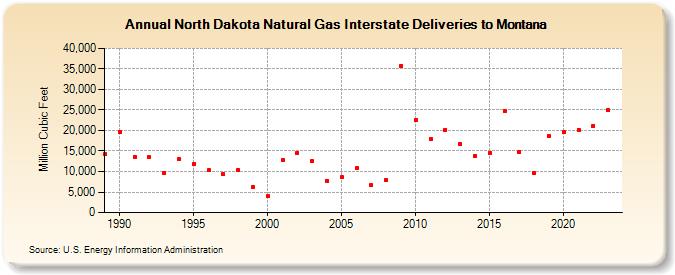
| North Dakota Natural Gas Interstate Deliveries to Montana (Million Cubic Feet) | |||||
| Decade | Year-0 | Year-1 | Year-2 | Year-3 | Year-4 | Year-5 | Year-6 | Year-7 | Year-8 | Year-9 |
|---|---|---|---|---|---|---|---|---|---|---|
| 1980's | 14,214 | |||||||||
| 1990's | 19,587 | 13,615 | 13,429 | 9,595 | 12,930 | 11,894 | 10,289 | 9,285 | 10,304 | 6,243 |
| 2000's | 3,930 | 12,862 | 14,609 | 12,474 | 7,796 | 8,571 | 10,765 | 6,671 | 7,878 | 35,803 |
| 2010's | 22,598 | 17,996 | 20,183 | 16,714 | 13,859 | 14,605 | 24,786 | 14,876 | 9,667 | 18,662 |
| 2020's | 19,588 | 20,210 | 21,125 | 24,948 | 54,881 |
| - = No Data Reported; -- = Not Applicable; NA = Not Available; W = Withheld to avoid disclosure of individual company data. |
| Release Date: 6/30/2026 |
| Next Release Date: 7/31/2026 |