|
Download Data (XLS File) |
|
|||||
|
|||||
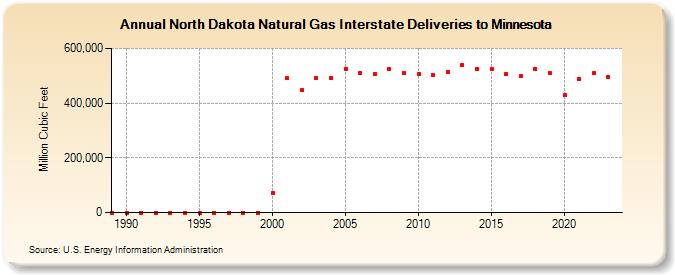
| North Dakota Natural Gas Interstate Deliveries to Minnesota (Million Cubic Feet) | |||||
| Decade | Year-0 | Year-1 | Year-2 | Year-3 | Year-4 | Year-5 | Year-6 | Year-7 | Year-8 | Year-9 |
|---|---|---|---|---|---|---|---|---|---|---|
| 1980's | 0 | |||||||||
| 1990's | 0 | 0 | 0 | 0 | 0 | 0 | 0 | 0 | 0 | 0 |
| 2000's | 73,076 | 491,080 | 448,736 | 492,099 | 491,825 | 526,046 | 510,297 | 507,496 | 523,260 | 509,437 |
| 2010's | 506,909 | 501,283 | 513,855 | 540,036 | 524,441 | 525,242 | 506,505 | 497,490 | 523,768 | 509,727 |
| 2020's | 427,945 | 487,412 | 510,021 | 494,926 | 512,643 |
| - = No Data Reported; -- = Not Applicable; NA = Not Available; W = Withheld to avoid disclosure of individual company data. |
| Release Date: 6/30/2026 |
| Next Release Date: 7/31/2026 |