|
Download Data (XLS File) |
|
|||||
|
|||||
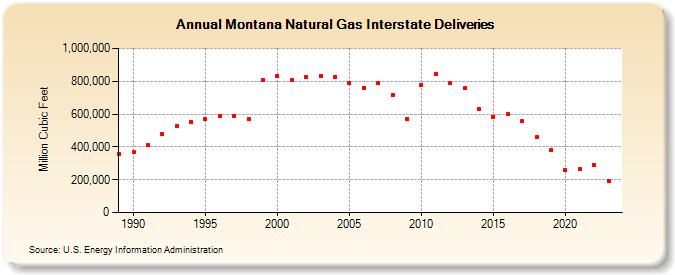
| Montana Natural Gas Interstate Deliveries (Million Cubic Feet) | |||||
| Decade | Year-0 | Year-1 | Year-2 | Year-3 | Year-4 | Year-5 | Year-6 | Year-7 | Year-8 | Year-9 |
|---|---|---|---|---|---|---|---|---|---|---|
| 1980's | 358,128 | |||||||||
| 1990's | 368,321 | 408,507 | 478,815 | 530,201 | 551,660 | 569,852 | 590,475 | 587,923 | 572,643 | 806,377 |
| 2000's | 831,482 | 806,534 | 825,205 | 830,437 | 823,702 | 788,048 | 759,932 | 790,384 | 718,224 | 570,882 |
| 2010's | 778,526 | 844,794 | 786,720 | 755,917 | 627,923 | 584,785 | 600,049 | 554,722 | 459,277 | 378,961 |
| 2020's | 257,801 | 266,101 | 288,386 | 192,403 | 213,531 |
| - = No Data Reported; -- = Not Applicable; NA = Not Available; W = Withheld to avoid disclosure of individual company data. |
| Release Date: 6/30/2026 |
| Next Release Date: 7/31/2026 |