|
Download Data (XLS File) |
|
|||||
|
|||||
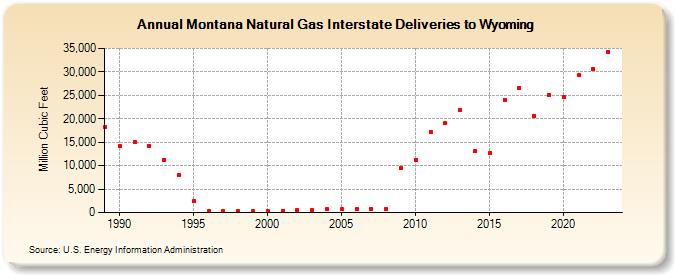
| Montana Natural Gas Interstate Deliveries to Wyoming (Million Cubic Feet) | |||||
| Decade | Year-0 | Year-1 | Year-2 | Year-3 | Year-4 | Year-5 | Year-6 | Year-7 | Year-8 | Year-9 |
|---|---|---|---|---|---|---|---|---|---|---|
| 1980's | 18,245 | |||||||||
| 1990's | 14,223 | 15,137 | 14,140 | 11,209 | 8,101 | 2,433 | 322 | 309 | 246 | 259 |
| 2000's | 304 | 411 | 468 | 507 | 710 | 667 | 715 | 761 | 753 | 9,448 |
| 2010's | 11,263 | 17,210 | 19,069 | 21,925 | 13,030 | 12,778 | 24,078 | 26,635 | 20,666 | 25,046 |
| 2020's | 24,558 | 29,236 | 30,511 | 34,292 | 60,233 |
| - = No Data Reported; -- = Not Applicable; NA = Not Available; W = Withheld to avoid disclosure of individual company data. |
| Release Date: 6/30/2026 |
| Next Release Date: 7/31/2026 |