|
Download Data (XLS File) |
|
|||||
|
|||||
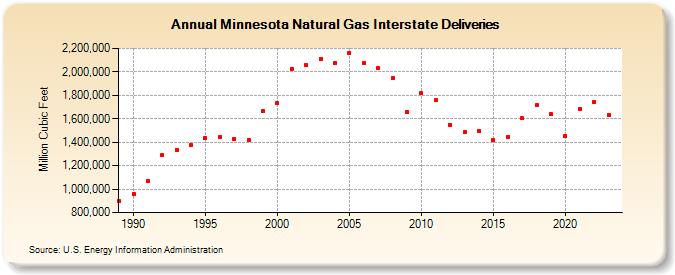
| Minnesota Natural Gas Interstate Deliveries (Million Cubic Feet) | |||||
| Decade | Year-0 | Year-1 | Year-2 | Year-3 | Year-4 | Year-5 | Year-6 | Year-7 | Year-8 | Year-9 |
|---|---|---|---|---|---|---|---|---|---|---|
| 1980's | 895,058 | |||||||||
| 1990's | 958,389 | 1,065,366 | 1,288,392 | 1,335,315 | 1,377,432 | 1,434,132 | 1,443,843 | 1,429,306 | 1,417,230 | 1,665,731 |
| 2000's | 1,730,499 | 2,026,551 | 2,058,076 | 2,112,329 | 2,076,537 | 2,161,569 | 2,073,178 | 2,032,481 | 1,946,899 | 1,659,019 |
| 2010's | 1,817,267 | 1,755,766 | 1,550,050 | 1,482,941 | 1,494,691 | 1,415,046 | 1,447,794 | 1,602,878 | 1,713,116 | 1,639,322 |
| 2020's | 1,453,715 | 1,684,538 | 1,746,157 | 1,629,348 | 1,782,550 |
| - = No Data Reported; -- = Not Applicable; NA = Not Available; W = Withheld to avoid disclosure of individual company data. |
| Release Date: 6/30/2026 |
| Next Release Date: 7/31/2026 |