|
Download Data (XLS File) |
|
|||||
|
|||||
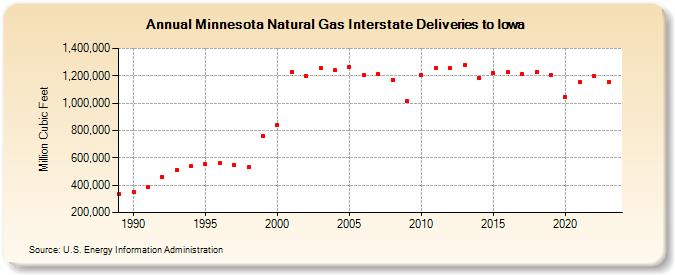
| Minnesota Natural Gas Interstate Deliveries to Iowa (Million Cubic Feet) | |||||
| Decade | Year-0 | Year-1 | Year-2 | Year-3 | Year-4 | Year-5 | Year-6 | Year-7 | Year-8 | Year-9 |
|---|---|---|---|---|---|---|---|---|---|---|
| 1980's | 334,663 | |||||||||
| 1990's | 353,604 | 389,992 | 461,828 | 511,551 | 537,774 | 552,998 | 564,359 | 547,322 | 530,154 | 758,414 |
| 2000's | 840,307 | 1,228,906 | 1,200,418 | 1,255,032 | 1,239,072 | 1,267,277 | 1,207,362 | 1,210,705 | 1,171,772 | 1,013,563 |
| 2010's | 1,203,209 | 1,253,307 | 1,257,967 | 1,279,019 | 1,186,727 | 1,218,829 | 1,226,804 | 1,216,308 | 1,226,463 | 1,203,752 |
| 2020's | 1,048,252 | 1,157,648 | 1,196,036 | 1,155,947 | 1,200,021 |
| - = No Data Reported; -- = Not Applicable; NA = Not Available; W = Withheld to avoid disclosure of individual company data. |
| Release Date: 6/30/2026 |
| Next Release Date: 7/31/2026 |