|
Download Data (XLS File) |
|
|||||
|
|||||
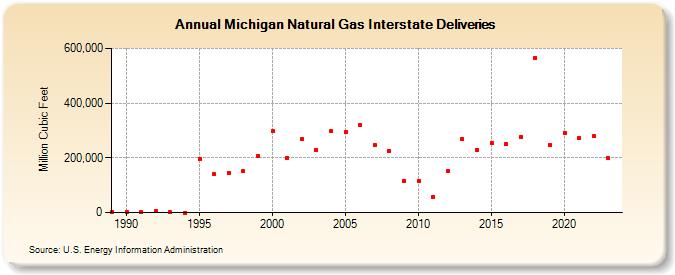
| Michigan Natural Gas Interstate Deliveries (Million Cubic Feet) | |||||
| Decade | Year-0 | Year-1 | Year-2 | Year-3 | Year-4 | Year-5 | Year-6 | Year-7 | Year-8 | Year-9 |
|---|---|---|---|---|---|---|---|---|---|---|
| 1980's | 1,495 | |||||||||
| 1990's | 3,088 | 2,506 | 6,268 | 431 | 0 | 196,589 | 139,929 | 146,328 | 150,741 | 207,115 |
| 2000's | 296,922 | 200,266 | 269,394 | 229,513 | 297,271 | 293,573 | 321,178 | 246,955 | 225,518 | 116,961 |
| 2010's | 115,066 | 56,903 | 150,868 | 269,123 | 229,399 | 254,493 | 250,306 | 277,941 | 564,960 | 248,506 |
| 2020's | 291,689 | 271,307 | 279,584 | 198,057 | 151,656 |
| - = No Data Reported; -- = Not Applicable; NA = Not Available; W = Withheld to avoid disclosure of individual company data. |
| Release Date: 6/30/2026 |
| Next Release Date: 7/31/2026 |