|
Download Data (XLS File) |
|
|||||
|
|||||
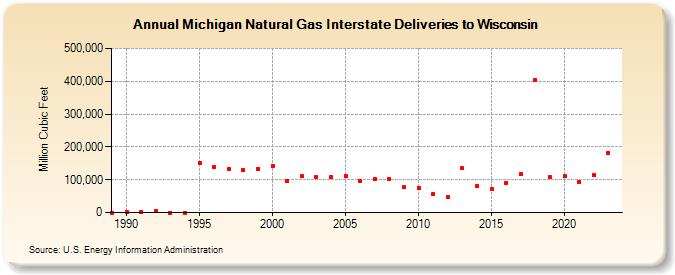
| Michigan Natural Gas Interstate Deliveries to Wisconsin (Million Cubic Feet) | |||||
| Decade | Year-0 | Year-1 | Year-2 | Year-3 | Year-4 | Year-5 | Year-6 | Year-7 | Year-8 | Year-9 |
|---|---|---|---|---|---|---|---|---|---|---|
| 1980's | 0 | |||||||||
| 1990's | 3,088 | 2,506 | 6,268 | 0 | 0 | 151,858 | 139,929 | 133,994 | 129,211 | 133,946 |
| 2000's | 142,541 | 97,233 | 111,265 | 107,572 | 107,728 | 110,854 | 96,544 | 102,550 | 101,133 | 76,856 |
| 2010's | 75,800 | 56,903 | 48,038 | 134,829 | 79,399 | 71,066 | 90,306 | 117,941 | 403,034 | 108,506 |
| 2020's | 110,046 | 93,862 | 112,897 | 182,026 | 119,729 |
| - = No Data Reported; -- = Not Applicable; NA = Not Available; W = Withheld to avoid disclosure of individual company data. |
| Release Date: 6/30/2026 |
| Next Release Date: 7/31/2026 |