|
Download Data (XLS File) |
|
|||||
|
|||||
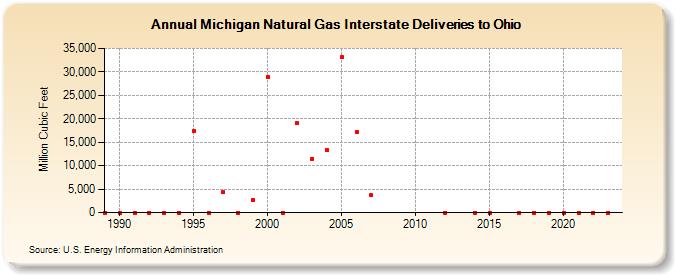
| Michigan Natural Gas Interstate Deliveries to Ohio (Million Cubic Feet) | |||||
| Decade | Year-0 | Year-1 | Year-2 | Year-3 | Year-4 | Year-5 | Year-6 | Year-7 | Year-8 | Year-9 |
|---|---|---|---|---|---|---|---|---|---|---|
| 1980's | 0 | |||||||||
| 1990's | 0 | 0 | 0 | 0 | 0 | 17,396 | 0 | 4,295 | 0 | 2,581 |
| 2000's | 28,963 | 0 | 19,072 | 11,437 | 13,360 | 33,092 | 17,163 | 3,725 | ||
| 2010's | 0 | 0 | 0 | 0 | 0 | 0 | ||||
| 2020's | 0 | 0 | 0 | 0 | 0 |
| - = No Data Reported; -- = Not Applicable; NA = Not Available; W = Withheld to avoid disclosure of individual company data. |
| Release Date: 6/30/2026 |
| Next Release Date: 7/31/2026 |