|
Download Data (XLS File) |
|
|||||
|
|||||
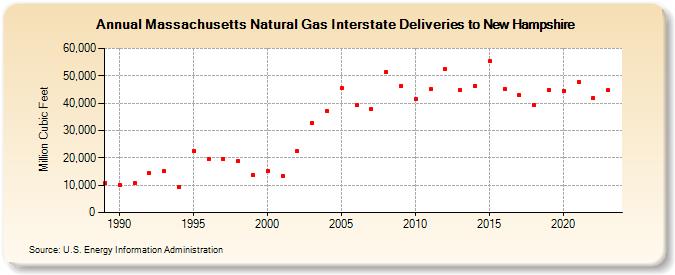
| Massachusetts Natural Gas Interstate Deliveries to New Hampshire (Million Cubic Feet) | |||||
| Decade | Year-0 | Year-1 | Year-2 | Year-3 | Year-4 | Year-5 | Year-6 | Year-7 | Year-8 | Year-9 |
|---|---|---|---|---|---|---|---|---|---|---|
| 1980's | 10,864 | |||||||||
| 1990's | 10,203 | 10,844 | 14,457 | 15,135 | 9,460 | 22,407 | 19,498 | 19,585 | 18,774 | 13,824 |
| 2000's | 15,159 | 13,493 | 22,318 | 32,669 | 37,142 | 45,553 | 39,131 | 37,815 | 51,383 | 46,256 |
| 2010's | 41,342 | 45,018 | 52,309 | 44,845 | 46,272 | 55,228 | 45,182 | 42,892 | 39,362 | 44,939 |
| 2020's | 44,551 | 47,717 | 41,795 | 44,616 | 36,040 |
| - = No Data Reported; -- = Not Applicable; NA = Not Available; W = Withheld to avoid disclosure of individual company data. |
| Release Date: 6/30/2026 |
| Next Release Date: 7/31/2026 |