|
Download Data (XLS File) |
|
|||||
|
|||||
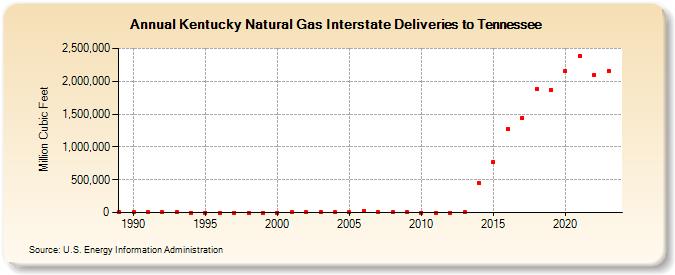
| Kentucky Natural Gas Interstate Deliveries to Tennessee (Million Cubic Feet) | |||||
| Decade | Year-0 | Year-1 | Year-2 | Year-3 | Year-4 | Year-5 | Year-6 | Year-7 | Year-8 | Year-9 |
|---|---|---|---|---|---|---|---|---|---|---|
| 1980's | 1,663 | |||||||||
| 1990's | 1,738 | 1,563 | 2,128 | 982 | 317 | 266 | 2 | 0 | 0 | 112 |
| 2000's | 775 | 1,367 | 1,460 | 1,702 | 1,668 | 4,080 | 28,209 | 12,234 | 1,849 | 2,541 |
| 2010's | 374 | 276 | 470 | 6,733 | 448,612 | 772,738 | 1,279,040 | 1,441,572 | 1,886,248 | 1,870,494 |
| 2020's | 2,154,827 | 2,385,890 | 2,099,438 | 2,163,014 | 2,210,502 |
| - = No Data Reported; -- = Not Applicable; NA = Not Available; W = Withheld to avoid disclosure of individual company data. |
| Release Date: 6/30/2026 |
| Next Release Date: 7/31/2026 |