|
Download Data (XLS File) |
|
|||||
|
|||||
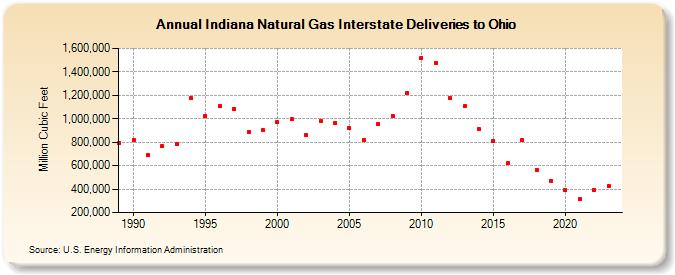
| Indiana Natural Gas Interstate Deliveries to Ohio (Million Cubic Feet) | |||||
| Decade | Year-0 | Year-1 | Year-2 | Year-3 | Year-4 | Year-5 | Year-6 | Year-7 | Year-8 | Year-9 |
|---|---|---|---|---|---|---|---|---|---|---|
| 1980's | 795,306 | |||||||||
| 1990's | 818,782 | 690,790 | 766,768 | 780,437 | 1,174,319 | 1,027,656 | 1,105,950 | 1,085,258 | 883,606 | 900,354 |
| 2000's | 968,414 | 996,901 | 857,200 | 984,559 | 965,762 | 918,057 | 821,090 | 954,336 | 1,024,108 | 1,218,053 |
| 2010's | 1,520,644 | 1,478,818 | 1,174,014 | 1,107,810 | 912,367 | 807,758 | 619,518 | 814,786 | 566,206 | 469,297 |
| 2020's | 390,644 | 312,946 | 396,557 | 428,358 | 343,996 |
| - = No Data Reported; -- = Not Applicable; NA = Not Available; W = Withheld to avoid disclosure of individual company data. |
| Release Date: 6/30/2026 |
| Next Release Date: 7/31/2026 |