|
Download Data (XLS File) |
|
|||||
|
|||||
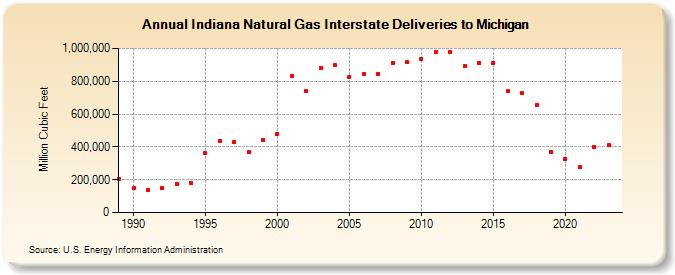
| Indiana Natural Gas Interstate Deliveries to Michigan (Million Cubic Feet) | |||||
| Decade | Year-0 | Year-1 | Year-2 | Year-3 | Year-4 | Year-5 | Year-6 | Year-7 | Year-8 | Year-9 |
|---|---|---|---|---|---|---|---|---|---|---|
| 1980's | 205,428 | |||||||||
| 1990's | 151,752 | 139,016 | 148,079 | 174,431 | 177,698 | 360,092 | 435,460 | 431,453 | 368,236 | 440,529 |
| 2000's | 480,500 | 834,191 | 742,181 | 881,758 | 898,623 | 828,343 | 847,036 | 847,042 | 914,038 | 914,504 |
| 2010's | 934,008 | 975,970 | 975,137 | 891,221 | 909,386 | 912,779 | 737,972 | 726,294 | 653,803 | 370,002 |
| 2020's | 327,297 | 276,147 | 397,856 | 410,263 | 338,539 |
| - = No Data Reported; -- = Not Applicable; NA = Not Available; W = Withheld to avoid disclosure of individual company data. |
| Release Date: 6/30/2026 |
| Next Release Date: 7/31/2026 |