|
Download Data (XLS File) |
|
|||||
|
|||||
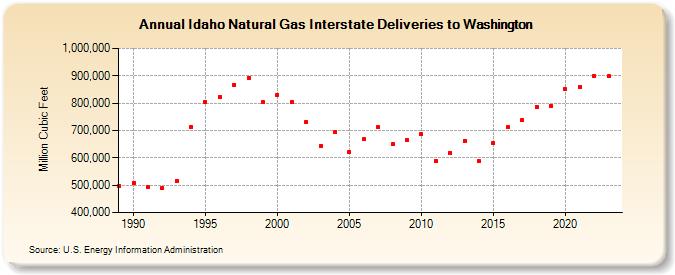
| Idaho Natural Gas Interstate Deliveries to Washington (Million Cubic Feet) | |||||
| Decade | Year-0 | Year-1 | Year-2 | Year-3 | Year-4 | Year-5 | Year-6 | Year-7 | Year-8 | Year-9 |
|---|---|---|---|---|---|---|---|---|---|---|
| 1980's | 497,794 | |||||||||
| 1990's | 508,705 | 493,474 | 489,429 | 515,637 | 713,026 | 804,621 | 823,898 | 867,820 | 892,007 | 803,053 |
| 2000's | 831,262 | 804,179 | 732,652 | 643,275 | 693,781 | 621,419 | 667,631 | 712,469 | 650,189 | 664,906 |
| 2010's | 686,675 | 589,701 | 618,824 | 662,666 | 588,366 | 652,985 | 711,640 | 738,474 | 787,614 | 790,074 |
| 2020's | 850,637 | 860,630 | 900,184 | 897,396 | 907,711 |
| - = No Data Reported; -- = Not Applicable; NA = Not Available; W = Withheld to avoid disclosure of individual company data. |
| Release Date: 6/30/2026 |
| Next Release Date: 7/31/2026 |
Referring Pages: