|
Download Data (XLS File) |
|
|||||
|
|||||
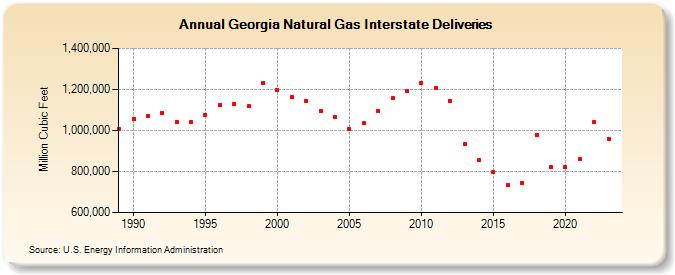
| Georgia Natural Gas Interstate Deliveries (Million Cubic Feet) | |||||
| Decade | Year-0 | Year-1 | Year-2 | Year-3 | Year-4 | Year-5 | Year-6 | Year-7 | Year-8 | Year-9 |
|---|---|---|---|---|---|---|---|---|---|---|
| 1980's | 1,007,074 | |||||||||
| 1990's | 1,057,288 | 1,070,813 | 1,085,345 | 1,041,851 | 1,039,839 | 1,075,834 | 1,124,962 | 1,129,650 | 1,116,847 | 1,233,464 |
| 2000's | 1,198,383 | 1,161,590 | 1,144,303 | 1,096,252 | 1,063,663 | 1,006,287 | 1,035,051 | 1,093,999 | 1,156,394 | 1,191,638 |
| 2010's | 1,231,642 | 1,206,119 | 1,145,863 | 935,151 | 857,554 | 799,030 | 733,390 | 746,401 | 976,877 | 820,824 |
| 2020's | 822,277 | 860,082 | 1,043,279 | 958,703 | 999,122 |
| - = No Data Reported; -- = Not Applicable; NA = Not Available; W = Withheld to avoid disclosure of individual company data. |
| Release Date: 6/30/2026 |
| Next Release Date: 7/31/2026 |