|
Download Data (XLS File) |
|
|||||
|
|||||
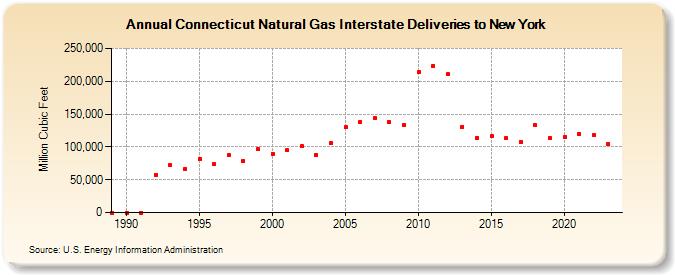
| Connecticut Natural Gas Interstate Deliveries to New York (Million Cubic Feet) | |||||
| Decade | Year-0 | Year-1 | Year-2 | Year-3 | Year-4 | Year-5 | Year-6 | Year-7 | Year-8 | Year-9 |
|---|---|---|---|---|---|---|---|---|---|---|
| 1980's | 0 | |||||||||
| 1990's | 0 | 0 | 57,811 | 71,921 | 66,647 | 81,278 | 73,343 | 87,496 | 78,692 | 96,710 |
| 2000's | 89,919 | 94,890 | 100,889 | 87,696 | 105,534 | 129,538 | 138,270 | 144,588 | 137,324 | 133,615 |
| 2010's | 213,488 | 223,383 | 210,524 | 130,873 | 113,871 | 116,027 | 112,867 | 107,817 | 132,619 | 113,312 |
| 2020's | 114,688 | 119,763 | 117,752 | 104,245 | 123,013 |
| - = No Data Reported; -- = Not Applicable; NA = Not Available; W = Withheld to avoid disclosure of individual company data. |
| Release Date: 6/30/2026 |
| Next Release Date: 7/31/2026 |