|
Download Data (XLS File) |
|
|||||
|
|||||
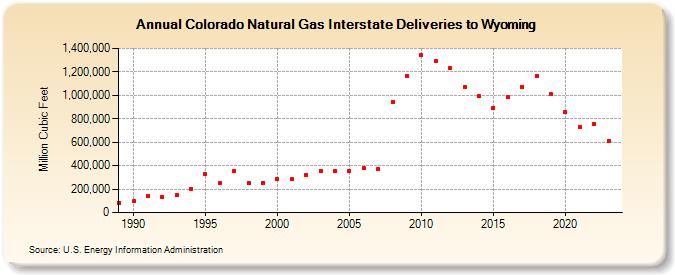
| Colorado Natural Gas Interstate Deliveries to Wyoming (Million Cubic Feet) | |||||
| Decade | Year-0 | Year-1 | Year-2 | Year-3 | Year-4 | Year-5 | Year-6 | Year-7 | Year-8 | Year-9 |
|---|---|---|---|---|---|---|---|---|---|---|
| 1980's | 84,459 | |||||||||
| 1990's | 97,470 | 139,403 | 132,423 | 150,531 | 200,771 | 325,630 | 249,670 | 356,709 | 252,249 | 252,636 |
| 2000's | 282,361 | 284,649 | 319,372 | 354,373 | 350,425 | 354,031 | 376,539 | 371,550 | 946,898 | 1,165,806 |
| 2010's | 1,343,657 | 1,289,820 | 1,234,593 | 1,068,760 | 991,016 | 895,233 | 984,515 | 1,074,973 | 1,166,289 | 1,008,490 |
| 2020's | 857,094 | 729,058 | 758,905 | 613,812 | 829,632 |
| - = No Data Reported; -- = Not Applicable; NA = Not Available; W = Withheld to avoid disclosure of individual company data. |
| Release Date: 6/30/2026 |
| Next Release Date: 7/31/2026 |