|
Download Data (XLS File) |
|
|||||
|
|||||
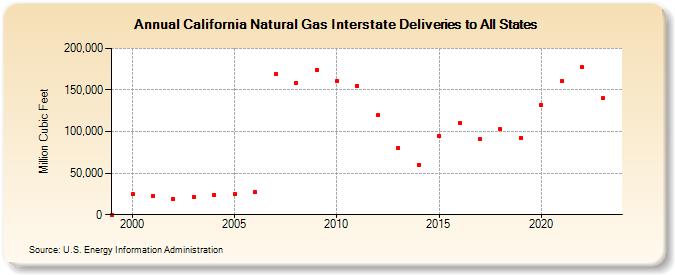
| California Natural Gas Interstate Deliveries to All States (Million Cubic Feet) | |||||
| Decade | Year-0 | Year-1 | Year-2 | Year-3 | Year-4 | Year-5 | Year-6 | Year-7 | Year-8 | Year-9 |
|---|---|---|---|---|---|---|---|---|---|---|
| 1990's | 0 | |||||||||
| 2000's | 24,809 | 22,507 | 19,189 | 21,532 | 24,203 | 24,786 | 27,407 | 169,070 | 158,433 | 174,422 |
| 2010's | 160,503 | 154,660 | 119,895 | 80,521 | 60,092 | 95,200 | 110,723 | 90,447 | 102,713 | 92,352 |
| 2020's | 132,044 | 160,832 | 177,613 | 140,036 | 129,533 |
| - = No Data Reported; -- = Not Applicable; NA = Not Available; W = Withheld to avoid disclosure of individual company data. |
| Release Date: 6/30/2026 |
| Next Release Date: 7/31/2026 |