|
Download Data (XLS File) |
|
|||||
|
|||||
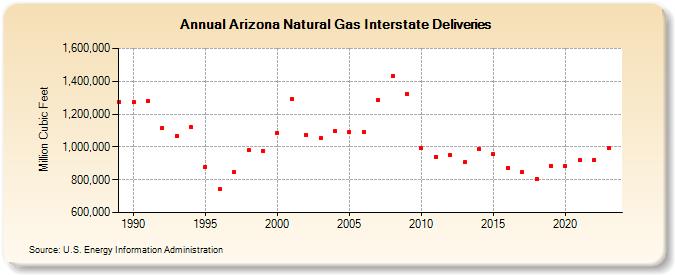
| Arizona Natural Gas Interstate Deliveries (Million Cubic Feet) | |||||
| Decade | Year-0 | Year-1 | Year-2 | Year-3 | Year-4 | Year-5 | Year-6 | Year-7 | Year-8 | Year-9 |
|---|---|---|---|---|---|---|---|---|---|---|
| 1980's | 1,275,692 | |||||||||
| 1990's | 1,270,461 | 1,279,952 | 1,117,497 | 1,069,293 | 1,119,548 | 879,159 | 740,632 | 844,452 | 982,517 | 977,041 |
| 2000's | 1,084,195 | 1,294,212 | 1,075,068 | 1,053,495 | 1,094,958 | 1,092,015 | 1,091,892 | 1,287,103 | 1,430,387 | 1,323,879 |
| 2010's | 991,473 | 940,673 | 951,872 | 906,952 | 986,920 | 954,718 | 873,994 | 845,918 | 807,270 | 885,694 |
| 2020's | 882,247 | 919,753 | 921,976 | 990,925 | 898,052 |
| - = No Data Reported; -- = Not Applicable; NA = Not Available; W = Withheld to avoid disclosure of individual company data. |
| Release Date: 6/30/2026 |
| Next Release Date: 7/31/2026 |