|
Download Data (XLS File) |
|
|||||
|
|||||
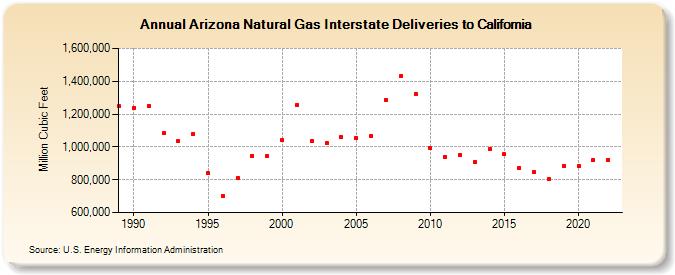
| Arizona Natural Gas Interstate Deliveries to California (Million Cubic Feet) | |||||
| Decade | Year-0 | Year-1 | Year-2 | Year-3 | Year-4 | Year-5 | Year-6 | Year-7 | Year-8 | Year-9 |
|---|---|---|---|---|---|---|---|---|---|---|
| 1980's | 1,246,680 | |||||||||
| 1990's | 1,239,101 | 1,249,592 | 1,083,121 | 1,033,400 | 1,079,711 | 840,681 | 700,796 | 813,065 | 946,692 | 941,488 |
| 2000's | 1,040,767 | 1,255,625 | 1,035,642 | 1,020,742 | 1,058,422 | 1,055,050 | 1,068,738 | 1,286,248 | 1,430,190 | 1,323,222 |
| 2010's | 991,458 | 940,673 | 951,872 | 906,952 | 986,896 | 954,718 | 873,969 | 845,896 | 807,268 | 885,692 |
| 2020's | 882,247 | 919,739 | 921,964 | 990,923 | 898,052 |
| - = No Data Reported; -- = Not Applicable; NA = Not Available; W = Withheld to avoid disclosure of individual company data. |
| Release Date: 6/30/2026 |
| Next Release Date: 7/31/2026 |