|
Download Data (XLS File) |
|
|||||
|
|||||
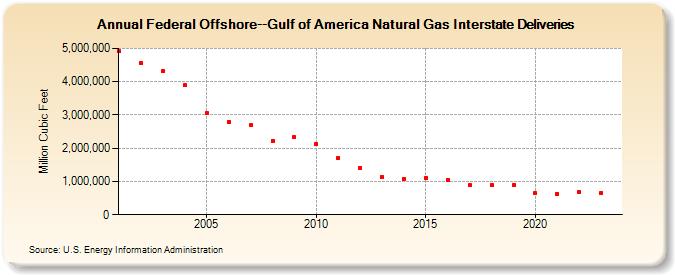
| Federal Offshore--Gulf of America Natural Gas Interstate Deliveries (Million Cubic Feet) | |||||
| Decade | Year-0 | Year-1 | Year-2 | Year-3 | Year-4 | Year-5 | Year-6 | Year-7 | Year-8 | Year-9 |
|---|---|---|---|---|---|---|---|---|---|---|
| 2000's | 4,913,606 | 4,564,077 | 4,307,340 | 3,885,215 | 3,053,950 | 2,799,727 | 2,683,190 | 2,224,553 | 2,324,941 | |
| 2010's | 2,136,572 | 1,711,029 | 1,413,495 | 1,145,462 | 1,084,508 | 1,117,163 | 1,049,245 | 882,019 | 896,494 | 899,164 |
| 2020's | 647,711 | 635,090 | 689,536 | 652,916 | 609,769 |
| - = No Data Reported; -- = Not Applicable; NA = Not Available; W = Withheld to avoid disclosure of individual company data. |
| Release Date: 6/30/2026 |
| Next Release Date: 7/31/2026 |