|
Download Data (XLS File) |
|
|||||
|
|||||
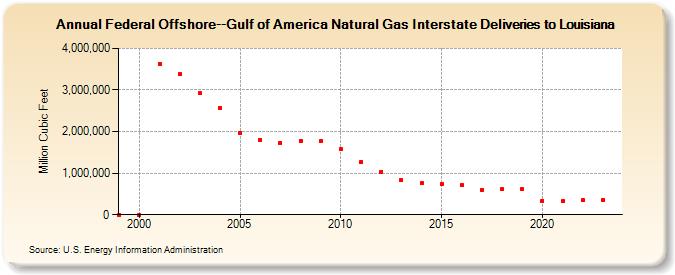
| Federal Offshore--Gulf of America Natural Gas Interstate Deliveries to Louisiana (Million Cubic Feet) | |||||
| Decade | Year-0 | Year-1 | Year-2 | Year-3 | Year-4 | Year-5 | Year-6 | Year-7 | Year-8 | Year-9 |
|---|---|---|---|---|---|---|---|---|---|---|
| 1990's | 0 | |||||||||
| 2000's | 0 | 3,636,069 | 3,377,420 | 2,925,448 | 2,564,034 | 1,970,653 | 1,808,808 | 1,733,517 | 1,784,584 | 1,765,893 |
| 2010's | 1,576,668 | 1,266,015 | 1,038,819 | 825,541 | 751,717 | 747,007 | 713,361 | 602,726 | 610,871 | 611,363 |
| 2020's | 341,060 | 323,617 | 342,905 | 353,862 | 317,875 |
| - = No Data Reported; -- = Not Applicable; NA = Not Available; W = Withheld to avoid disclosure of individual company data. |
| Release Date: 6/30/2026 |
| Next Release Date: 7/31/2026 |