|
Download Data (XLS File) |
|
|||||
|
|||||
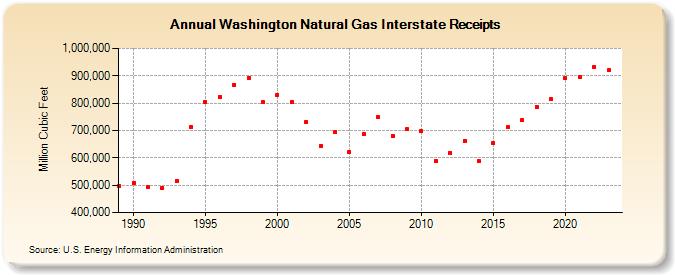
| Washington Natural Gas Interstate Receipts (Million Cubic Feet) | |||||
| Decade | Year-0 | Year-1 | Year-2 | Year-3 | Year-4 | Year-5 | Year-6 | Year-7 | Year-8 | Year-9 |
|---|---|---|---|---|---|---|---|---|---|---|
| 1980's | 497,794 | |||||||||
| 1990's | 508,705 | 493,474 | 491,200 | 515,637 | 713,101 | 804,621 | 823,997 | 867,820 | 892,082 | 803,073 |
| 2000's | 831,267 | 804,179 | 732,652 | 643,275 | 693,781 | 621,419 | 686,575 | 748,469 | 681,309 | 704,102 |
| 2010's | 697,556 | 589,701 | 618,824 | 662,666 | 588,366 | 652,985 | 711,640 | 738,474 | 787,615 | 814,569 |
| 2020's | 892,386 | 897,171 | 933,057 | 919,631 | 927,883 |
| - = No Data Reported; -- = Not Applicable; NA = Not Available; W = Withheld to avoid disclosure of individual company data. |
| Release Date: 6/30/2026 |
| Next Release Date: 7/31/2026 |