|
Download Data (XLS File) |
|
|||||
|
|||||
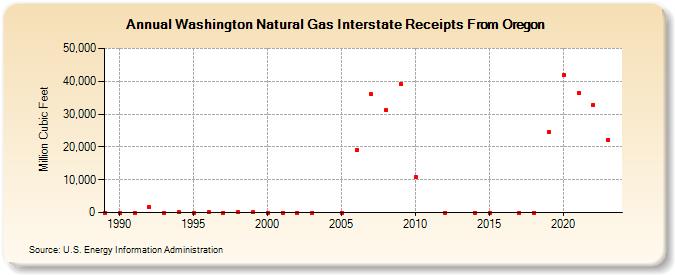
| Washington Natural Gas Interstate Receipts From Oregon (Million Cubic Feet) | |||||
| Decade | Year-0 | Year-1 | Year-2 | Year-3 | Year-4 | Year-5 | Year-6 | Year-7 | Year-8 | Year-9 |
|---|---|---|---|---|---|---|---|---|---|---|
| 1980's | 0 | |||||||||
| 1990's | 0 | 0 | 1,771 | 0 | 76 | 0 | 99 | 0 | 76 | 20 |
| 2000's | 5 | 0 | 0 | 0 | 0 | 18,944 | 36,000 | 31,120 | 39,196 | |
| 2010's | 10,881 | 0 | 0 | 0 | 0 | 0 | 24,495 | |||
| 2020's | 41,750 | 36,541 | 32,873 | 22,236 | 20,172 |
| - = No Data Reported; -- = Not Applicable; NA = Not Available; W = Withheld to avoid disclosure of individual company data. |
| Release Date: 6/30/2026 |
| Next Release Date: 7/31/2026 |