|
Download Data (XLS File) |
|
|||||
|
|||||
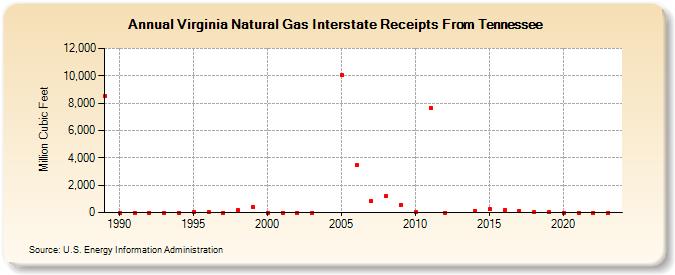
| Virginia Natural Gas Interstate Receipts From Tennessee (Million Cubic Feet) | |||||
| Decade | Year-0 | Year-1 | Year-2 | Year-3 | Year-4 | Year-5 | Year-6 | Year-7 | Year-8 | Year-9 |
|---|---|---|---|---|---|---|---|---|---|---|
| 1980's | 8,507 | |||||||||
| 1990's | 0 | 0 | 0 | 0 | 0 | 43 | 70 | 1 | 181 | 426 |
| 2000's | 0 | 0 | 0 | 0 | 10,026 | 3,464 | 851 | 1,191 | 589 | |
| 2010's | 73 | 7,658 | 0 | 115 | 225 | 183 | 113 | 48 | 37 | |
| 2020's | 0 | 0 | 0 | 0 | 0 |
| - = No Data Reported; -- = Not Applicable; NA = Not Available; W = Withheld to avoid disclosure of individual company data. |
| Release Date: 6/30/2026 |
| Next Release Date: 7/31/2026 |