|
Download Data (XLS File) |
|
|||||
|
|||||
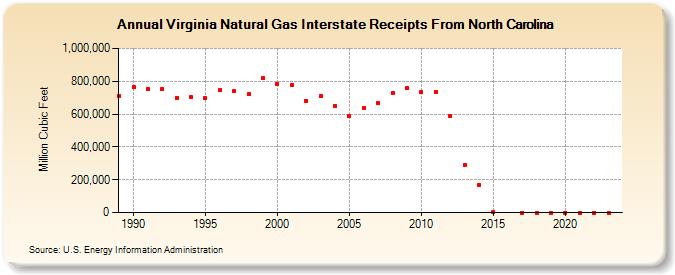
| Virginia Natural Gas Interstate Receipts From North Carolina (Million Cubic Feet) | |||||
| Decade | Year-0 | Year-1 | Year-2 | Year-3 | Year-4 | Year-5 | Year-6 | Year-7 | Year-8 | Year-9 |
|---|---|---|---|---|---|---|---|---|---|---|
| 1980's | 710,083 | |||||||||
| 1990's | 765,691 | 751,862 | 752,237 | 700,015 | 702,517 | 696,000 | 744,068 | 737,497 | 721,564 | 818,593 |
| 2000's | 785,410 | 777,555 | 681,690 | 711,402 | 650,771 | 587,713 | 634,501 | 666,055 | 725,448 | 758,715 |
| 2010's | 735,602 | 735,148 | 590,308 | 287,940 | 168,887 | 5,379 | 0 | 0 | 0 | |
| 2020's | 0 | 0 | 0 | 0 | 0 |
| - = No Data Reported; -- = Not Applicable; NA = Not Available; W = Withheld to avoid disclosure of individual company data. |
| Release Date: 6/30/2026 |
| Next Release Date: 7/31/2026 |