|
Download Data (XLS File) |
|
|||||
|
|||||
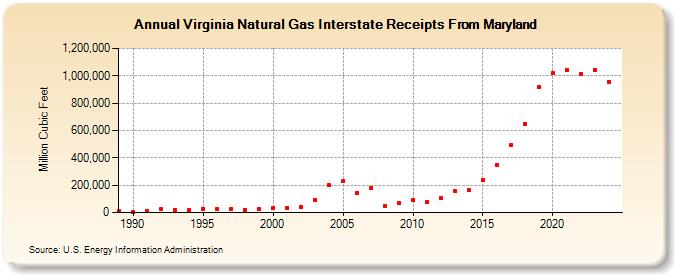
| Virginia Natural Gas Interstate Receipts From Maryland (Million Cubic Feet) | |||||
| Decade | Year-0 | Year-1 | Year-2 | Year-3 | Year-4 | Year-5 | Year-6 | Year-7 | Year-8 | Year-9 |
|---|---|---|---|---|---|---|---|---|---|---|
| 1980's | 8,749 | |||||||||
| 1990's | 6,399 | 10,892 | 23,315 | 19,646 | 15,110 | 28,163 | 26,782 | 26,257 | 21,886 | 23,224 |
| 2000's | 36,719 | 36,523 | 42,218 | 92,143 | 199,790 | 227,555 | 146,226 | 180,224 | 48,292 | 73,019 |
| 2010's | 91,247 | 75,734 | 103,575 | 157,080 | 162,195 | 234,727 | 349,143 | 496,863 | 648,694 | 918,268 |
| 2020's | 1,017,035 | 1,039,851 | 1,015,620 | 1,040,489 | 956,700 |
| - = No Data Reported; -- = Not Applicable; NA = Not Available; W = Withheld to avoid disclosure of individual company data. |
| Release Date: 6/30/2026 |
| Next Release Date: 7/31/2026 |