|
Download Data (XLS File) |
|
|||||
|
|||||
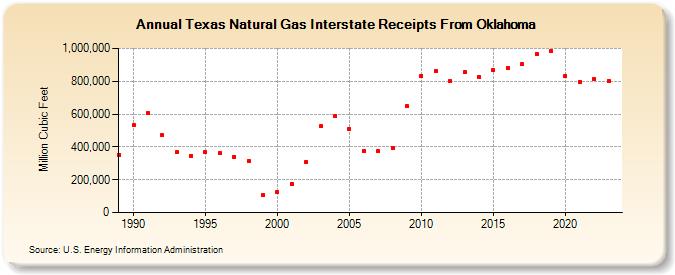
| Texas Natural Gas Interstate Receipts From Oklahoma (Million Cubic Feet) | |||||
| Decade | Year-0 | Year-1 | Year-2 | Year-3 | Year-4 | Year-5 | Year-6 | Year-7 | Year-8 | Year-9 |
|---|---|---|---|---|---|---|---|---|---|---|
| 1980's | 353,579 | |||||||||
| 1990's | 531,788 | 607,495 | 470,632 | 366,838 | 345,299 | 368,805 | 361,630 | 341,030 | 316,414 | 107,006 |
| 2000's | 126,409 | 175,364 | 310,298 | 524,596 | 586,950 | 509,175 | 377,777 | 373,718 | 393,720 | 646,799 |
| 2010's | 834,311 | 860,059 | 800,292 | 855,255 | 826,235 | 866,108 | 882,227 | 903,366 | 967,096 | 986,915 |
| 2020's | 832,414 | 795,561 | 814,121 | 803,786 | 816,830 |
| - = No Data Reported; -- = Not Applicable; NA = Not Available; W = Withheld to avoid disclosure of individual company data. |
| Release Date: 6/30/2026 |
| Next Release Date: 7/31/2026 |
Referring Pages: