|
Download Data (XLS File) |
|
|||||
|
|||||
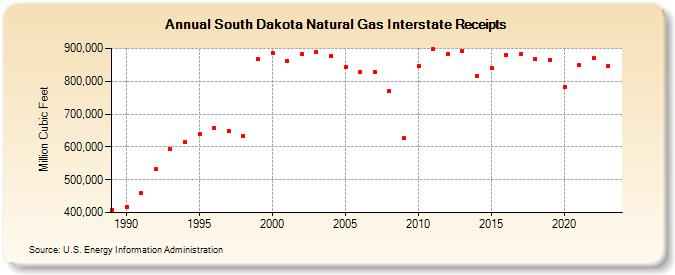
| South Dakota Natural Gas Interstate Receipts (Million Cubic Feet) | |||||
| Decade | Year-0 | Year-1 | Year-2 | Year-3 | Year-4 | Year-5 | Year-6 | Year-7 | Year-8 | Year-9 |
|---|---|---|---|---|---|---|---|---|---|---|
| 1980's | 408,928 | |||||||||
| 1990's | 417,567 | 459,068 | 532,549 | 592,248 | 613,908 | 638,002 | 656,552 | 648,098 | 633,863 | 866,666 |
| 2000's | 886,757 | 862,619 | 883,309 | 890,141 | 877,036 | 842,345 | 828,605 | 829,166 | 769,669 | 628,284 |
| 2010's | 845,288 | 898,928 | 883,786 | 890,571 | 817,324 | 838,817 | 879,471 | 881,560 | 867,693 | 864,865 |
| 2020's | 781,075 | 849,122 | 870,179 | 846,705 | 867,579 |
| - = No Data Reported; -- = Not Applicable; NA = Not Available; W = Withheld to avoid disclosure of individual company data. |
| Release Date: 6/30/2026 |
| Next Release Date: 7/31/2026 |