|
Download Data (XLS File) |
|
|||||
|
|||||
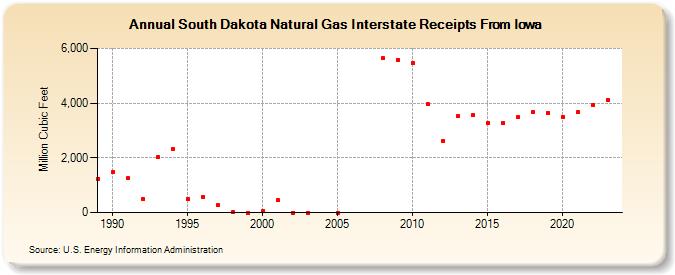
| South Dakota Natural Gas Interstate Receipts From Iowa (Million Cubic Feet) | |||||
| Decade | Year-0 | Year-1 | Year-2 | Year-3 | Year-4 | Year-5 | Year-6 | Year-7 | Year-8 | Year-9 |
|---|---|---|---|---|---|---|---|---|---|---|
| 1980's | 1,236 | |||||||||
| 1990's | 1,469 | 1,247 | 491 | 2,016 | 2,308 | 499 | 569 | 266 | 5 | 0 |
| 2000's | 61 | 443 | 0 | 0 | 0 | 5,637 | 5,585 | |||
| 2010's | 5,454 | 3,953 | 2,620 | 3,516 | 3,553 | 3,262 | 3,289 | 3,476 | 3,658 | 3,649 |
| 2020's | 3,489 | 3,665 | 3,938 | 4,120 | 4,037 |
| - = No Data Reported; -- = Not Applicable; NA = Not Available; W = Withheld to avoid disclosure of individual company data. |
| Release Date: 6/30/2026 |
| Next Release Date: 7/31/2026 |