|
Download Data (XLS File) |
|
|||||
|
|||||
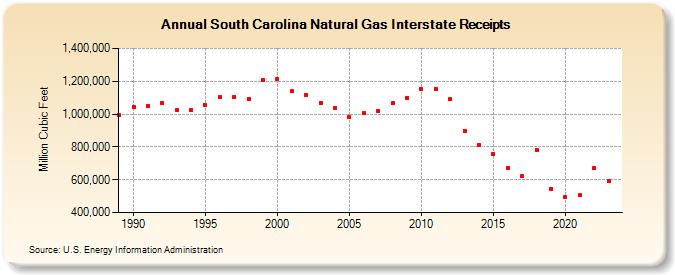
| South Carolina Natural Gas Interstate Receipts (Million Cubic Feet) | |||||
| Decade | Year-0 | Year-1 | Year-2 | Year-3 | Year-4 | Year-5 | Year-6 | Year-7 | Year-8 | Year-9 |
|---|---|---|---|---|---|---|---|---|---|---|
| 1980's | 993,292 | |||||||||
| 1990's | 1,042,099 | 1,050,481 | 1,065,954 | 1,024,140 | 1,025,779 | 1,053,357 | 1,102,786 | 1,105,842 | 1,091,920 | 1,210,330 |
| 2000's | 1,212,184 | 1,138,120 | 1,118,507 | 1,069,638 | 1,036,040 | 979,459 | 1,006,904 | 1,021,515 | 1,065,801 | 1,098,365 |
| 2010's | 1,149,855 | 1,153,358 | 1,088,903 | 899,292 | 813,295 | 757,517 | 673,990 | 620,474 | 784,028 | 545,396 |
| 2020's | 493,145 | 503,977 | 670,554 | 592,232 | 617,596 |
| - = No Data Reported; -- = Not Applicable; NA = Not Available; W = Withheld to avoid disclosure of individual company data. |
| Release Date: 6/30/2026 |
| Next Release Date: 7/31/2026 |