|
Download Data (XLS File) |
|
|||||
|
|||||
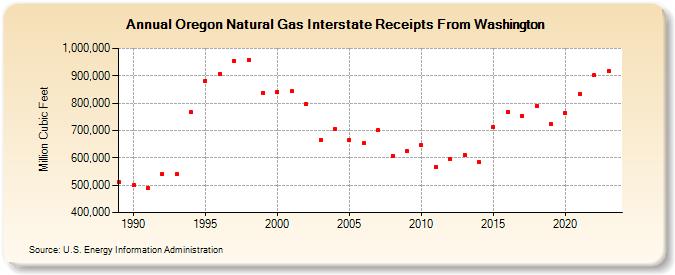
| Oregon Natural Gas Interstate Receipts From Washington (Million Cubic Feet) | |||||
| Decade | Year-0 | Year-1 | Year-2 | Year-3 | Year-4 | Year-5 | Year-6 | Year-7 | Year-8 | Year-9 |
|---|---|---|---|---|---|---|---|---|---|---|
| 1980's | 510,333 | |||||||||
| 1990's | 500,269 | 488,666 | 541,201 | 540,702 | 765,764 | 882,385 | 906,506 | 954,325 | 957,810 | 837,922 |
| 2000's | 841,625 | 843,213 | 796,061 | 666,614 | 705,686 | 664,318 | 653,129 | 700,268 | 607,759 | 624,313 |
| 2010's | 646,454 | 566,932 | 595,888 | 611,717 | 584,389 | 712,930 | 768,479 | 754,567 | 789,877 | 723,513 |
| 2020's | 763,706 | 833,405 | 901,494 | 918,129 | 925,427 |
| - = No Data Reported; -- = Not Applicable; NA = Not Available; W = Withheld to avoid disclosure of individual company data. |
| Release Date: 6/30/2026 |
| Next Release Date: 7/31/2026 |