|
Download Data (XLS File) |
|
|||||
|
|||||
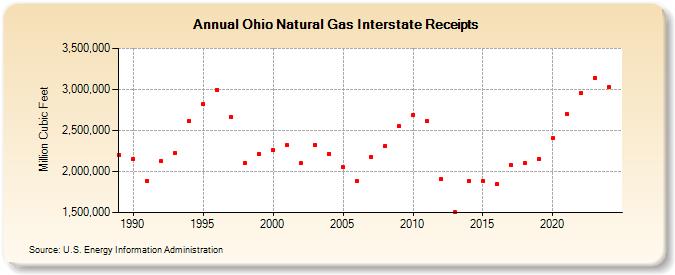
| Ohio Natural Gas Interstate Receipts (Million Cubic Feet) | |||||
| Decade | Year-0 | Year-1 | Year-2 | Year-3 | Year-4 | Year-5 | Year-6 | Year-7 | Year-8 | Year-9 |
|---|---|---|---|---|---|---|---|---|---|---|
| 1980's | 2,198,268 | |||||||||
| 1990's | 2,154,654 | 1,889,579 | 2,125,670 | 2,226,113 | 2,617,648 | 2,817,908 | 2,997,400 | 2,662,578 | 2,108,289 | 2,213,648 |
| 2000's | 2,264,581 | 2,319,242 | 2,098,745 | 2,327,677 | 2,218,745 | 2,050,884 | 1,880,787 | 2,177,237 | 2,308,071 | 2,550,746 |
| 2010's | 2,689,580 | 2,611,779 | 1,904,858 | 1,503,467 | 1,887,321 | 1,886,964 | 1,843,006 | 2,074,896 | 2,107,493 | 2,154,847 |
| 2020's | 2,407,948 | 2,698,483 | 2,954,457 | 3,143,835 | 3,031,237 |
| - = No Data Reported; -- = Not Applicable; NA = Not Available; W = Withheld to avoid disclosure of individual company data. |
| Release Date: 6/30/2026 |
| Next Release Date: 7/31/2026 |