|
Download Data (XLS File) |
|
|||||
|
|||||
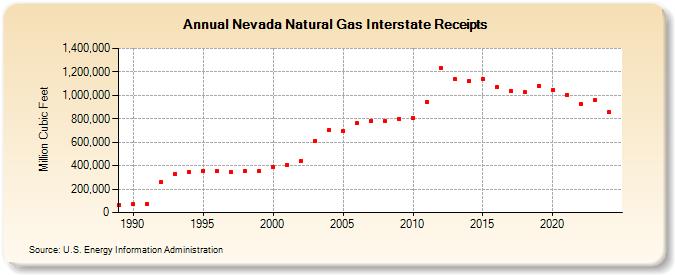
| Nevada Natural Gas Interstate Receipts (Million Cubic Feet) | |||||
| Decade | Year-0 | Year-1 | Year-2 | Year-3 | Year-4 | Year-5 | Year-6 | Year-7 | Year-8 | Year-9 |
|---|---|---|---|---|---|---|---|---|---|---|
| 1980's | 65,715 | |||||||||
| 1990's | 68,994 | 69,164 | 259,899 | 329,846 | 348,147 | 355,804 | 356,416 | 343,785 | 357,695 | 354,582 |
| 2000's | 391,113 | 404,832 | 440,565 | 613,136 | 703,652 | 694,808 | 763,419 | 783,127 | 782,527 | 800,281 |
| 2010's | 804,953 | 946,709 | 1,231,360 | 1,134,742 | 1,121,828 | 1,139,721 | 1,068,897 | 1,038,515 | 1,024,725 | 1,082,508 |
| 2020's | 1,043,455 | 1,006,681 | 929,011 | 958,582 | 855,069 |
| - = No Data Reported; -- = Not Applicable; NA = Not Available; W = Withheld to avoid disclosure of individual company data. |
| Release Date: 6/30/2026 |
| Next Release Date: 7/31/2026 |