|
Download Data (XLS File) |
|
|||||
|
|||||
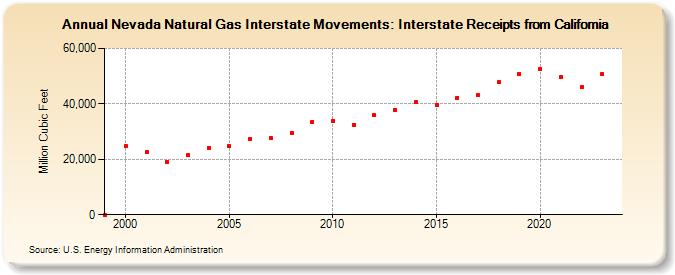
| Nevada Natural Gas Interstate Movements: Interstate Receipts from California (Million Cubic Feet) | |||||
| Decade | Year-0 | Year-1 | Year-2 | Year-3 | Year-4 | Year-5 | Year-6 | Year-7 | Year-8 | Year-9 |
|---|---|---|---|---|---|---|---|---|---|---|
| 1990's | 0 | |||||||||
| 2000's | 24,809 | 22,507 | 19,189 | 21,532 | 24,203 | 24,786 | 27,407 | 27,613 | 29,620 | 33,541 |
| 2010's | 33,937 | 32,462 | 35,903 | 37,911 | 40,659 | 39,563 | 42,277 | 43,108 | 47,750 | 50,789 |
| 2020's | 52,568 | 49,654 | 45,998 | 50,849 | 48,413 |
| - = No Data Reported; -- = Not Applicable; NA = Not Available; W = Withheld to avoid disclosure of individual company data. |
| Release Date: 6/30/2026 |
| Next Release Date: 7/31/2026 |