|
Download Data (XLS File) |
|
|||||
|
|||||
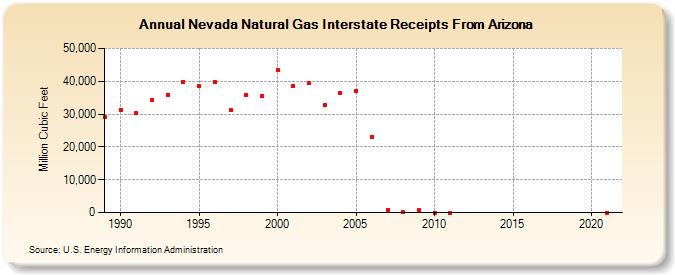
| Nevada Natural Gas Interstate Receipts From Arizona (Million Cubic Feet) | |||||
| Decade | Year-0 | Year-1 | Year-2 | Year-3 | Year-4 | Year-5 | Year-6 | Year-7 | Year-8 | Year-9 |
|---|---|---|---|---|---|---|---|---|---|---|
| 1980's | 29,012 | |||||||||
| 1990's | 31,360 | 30,361 | 34,376 | 35,893 | 39,837 | 38,478 | 39,836 | 31,386 | 35,825 | 35,553 |
| 2000's | 43,427 | 38,588 | 39,426 | 32,753 | 36,536 | 36,965 | 23,154 | 855 | 198 | 657 |
| 2010's | 15 | 0 | ||||||||
| 2020's | 13 |
| - = No Data Reported; -- = Not Applicable; NA = Not Available; W = Withheld to avoid disclosure of individual company data. |
| Release Date: 6/30/2026 |
| Next Release Date: 7/31/2026 |